


Magic Formula - Letter to subscribers - 04/10/2024
Q4 2024

Disclaimer: This article is for informational and educational purposes only. Do not interpret anything below as financial advice. Always do your own research & speak to a financial professional before making investment decisions.
I’ve now been running this Magic Formula portfolio for ~3 years. So far the results haven’t been overwhelming. Far from it. I’m up barely up a percentage point since 2021 while the S&P 500 index has gained ~9% in the same timeframe.
An $10,000 lump sum in November 2021 would have grown to almost $13,000 by simply investing in the US index. By investing like I have, it would have grown to a mere $10,200. When compounded over a longer period, e.g. 15 years, the difference is much more shocking ($24,000 for the S&P 500 vs. $11,000 for the Magic Formula. And that’s without investing a single additional dollar!
The investing business is certainly a humbling one. The above example clearly demonstrates that while small percentage differences of outperformance may seem minor over a few years, the results change dramatically over a larger period.
For this reason, given the stage I’m at in this experiment, it is more important than ever to exercise complete focus and discipline for every future buy, sell and hold decision.
As of 05/10/2024, results are as follows:
Investments: 16
Performance since inception: 1.78% vs. 9.28% (S&P 500)
Performance this financial year: 1.33% vs. 22.44% (S&P 500)
The process I use to select and review stocks is relatively straightforward. Four times a year (once per quarter) I make a list of the 50 stocks that show up on the Magic Formula screener and rank them according to the below filters:
FCFPS (Growth)
I prefer using per share growth for free cash flow growth rate because it helps me assess management’s ability to improve financial health generating increased value by not diluting shareholders. I am not too concerned about a specific hurdle rate for this one, as long as some growth is there.
ROIC (Profitability)
This metric reveals how effectively a company generates profit from its capital investments, with a higher ROIC figure suggesting a track record of efficient use of capital to create value. My hurdle rate is typically a 10-Yr Median ROIC figure of at least 15%.
FCF Conversion (Efficiency)
I started using this metric after a year or so of running the experiment. It provides useful insights into how well a company converts its income (I use operating income) into actual cash flow, indicating financial sustainability and quality of earnings. I opt for companies that have a 10-Yr Median FCF conversion ratio of above 0.8 meaning at least 80% of their operating income is converted into free cash flow.
Net Debt / FCF (Leverage)
I’m a conservative investor and look for companies that have very little debt if any. This metric helps assess the company’s ability to pay off its debt using its free cash flow, with lower ratios suggesting lower financial risk and better debt management. I look for companies with ratios lower than 3, i.e. ones who can pay off all their net debt in 3 years at most.
FCF / EV Yield (Valuation)
Finally, I assess the FCF / EV Yield of the company. This provides insight into the company’s valuation, with higher yields indicating better cash flow generation relative to the company’s entire capital structure. I prefer using EV instead of market cap because it reflects the company’s total value, including debt. My target is to purchase companies yielding 10% or above.
Note: I use QuickFS and Koyfin to source the data.
Before adding any new stocks to the portfolio, I review existing holdings each year to check if they still align with the 5 criteria listed above. The companies reviewed in the most recent period (Q3) were Robert Half International Inc (RHI), Thor Industries Inc (THO), Best Buy Co. Inc (BBY), Warrior Met Coal Inc (HCC) and Ocuphire Pharma Inc (OCUP).

How did they stack up?
I’m not sure how Ocuphire Pharma ended up in the portfolio but I’m glad it’s not anymore. With financial data only going back to 2019, this was an easy sell given the lack of long term FCFPS growth. Even using only the available data, the growth was negative. Figure 1 shows the existing holdings reviewed in the third quarter of 2024.
Figure 1: Q3 Current Positions Review
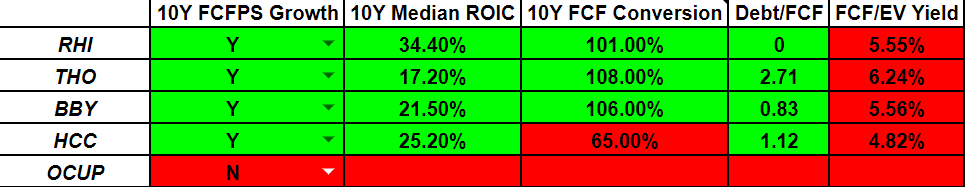
Source: QuantCompounding material
As the figure indicates, all the remaining companies had positive FCFPS growth with impressive 10-Yr Median ROIC numbers, all scoring above 20%. Warrior Met Coal Inc didn’t achieve a FCF Conversion ratio above 80% like the remaining three companies (who all scored above 100%).
Nevertheless, I decided to avoid selling the company, since there were only 9 years of data available on QuickFS to dissect while Robert Half, Thor Industries and Best Buy were all assessed using 10 years of data. Sometimes such use cases appear and as investors we must decide what makes most sense for the portfolio. In this case, my gut tells me holding that Warrior, my fourth best performing stock, will pay off in the long run.
Debt levels for the companies remain manageable for the companies, yet none of them were attractive enough to scoop up in the third quarter. Let’s now take a look at the companies that appeared on the Magic Formula screener in the third quarter.
Without coffee, this newsletter would suffer. Support me here!
Figure 2: Q3 New Positions Review
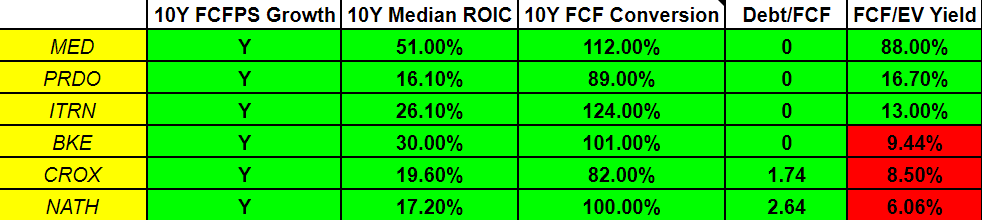
Source: QuantCompounding material
Some familiar faces continue to appear on the screener in Medifast Inc (MED) and Buckle Inc (BKE). Regular readers of the newsletter know that Buckle is a favourite of mine and one that I continue to add to provided the valuation is sufficiently attractive. Unfortunately this wasn’t the case this time, with only three companies passing all of the filters in Medifast, Perdoceo Education Corp (PRDO) and Ituran Location and Control Ltd (ITRN).
I’ve previously written about why I am cautious to add more to Medifast, despite the optically impressive results. This is a company that has continued to underperform in recent years and given the exposure I already have, I am happy to avoid adding to my existing position, which is down about 70% since inception and is by far my worst performing holding.
That left Perdoceo Education Corp and Ituran Location and Control as the only viable options for assessment. The former is a stock that has shown up in the past but remains unavailable to trade on my brokerage platform. This is a shame actually, given the stock was also viable to purchase in a 2022 write up and was trading at ~$10 at the time. It now trades at $21.58, so had I been able to invest, it would have achieved a 46.9% CAGR during that time.
I ended up investing in Ituran Location and Control in the third quarter of FY2024, an Israeli company that provides location based telematics services and machine-to-machine telematics products. It has a $500m market cap, a solid operating history trading and trades at an enticing 13% FCF yield. What I like about the company is that 70% of its revenues come from recurring subscription fees and their main Stolen Vehicle Recovery (SVR) product seems to be extremely sticky due to the complexity of the integrations necessary to make it deeply embedded in the car for added protection. Here’s an interesting write up on Value Investors Club that dives into the company in further detail.
The company also pays a 6% dividend at today’s pricing which is extremely enticing and means not much earnings growth is required for a decent return. Any buybacks and/or multiple expansion on top of that would make for a really interesting bet. Ituran also holds a 17% stake in Bringg, a company that was valued at $1 billion, increasing the potential for a huge liquidity event in the event of an IPO, which makes the current valuation even more interesting.
Given the ongoing crisis in the country and the fact that around half of the company’s revenues are generated from Israel, this one doesn’t come without risks but it is certainly interesting and I’m looking forward to seeing how it pans out.
I will probably be releasing my Q4 letter in the first week of January. Until then, please do leave a comment and get in touch if you want to discuss anything with me. I’d be interested in sharing ideas.
Thanks,
QC
Koyfin Discount
I’m not one to promote products I don’t use personally.
Koyfin lets you pull all the metrics discussed on the newsletter including FCF/EV yield and years worth of financial data.
By using this link you can enjoy a 10% discount to Koyfin’s Plus and Pro plans.
It also helps support this publication’s growth!